 OSU Pytheas - Data Catalog
geophysical environment
Type of resources
Available actions
Topics
INSPIRE themes
Keywords
Contact for the resource
Provided by
Formats
Representation types
Update frequencies
status
Scale
-
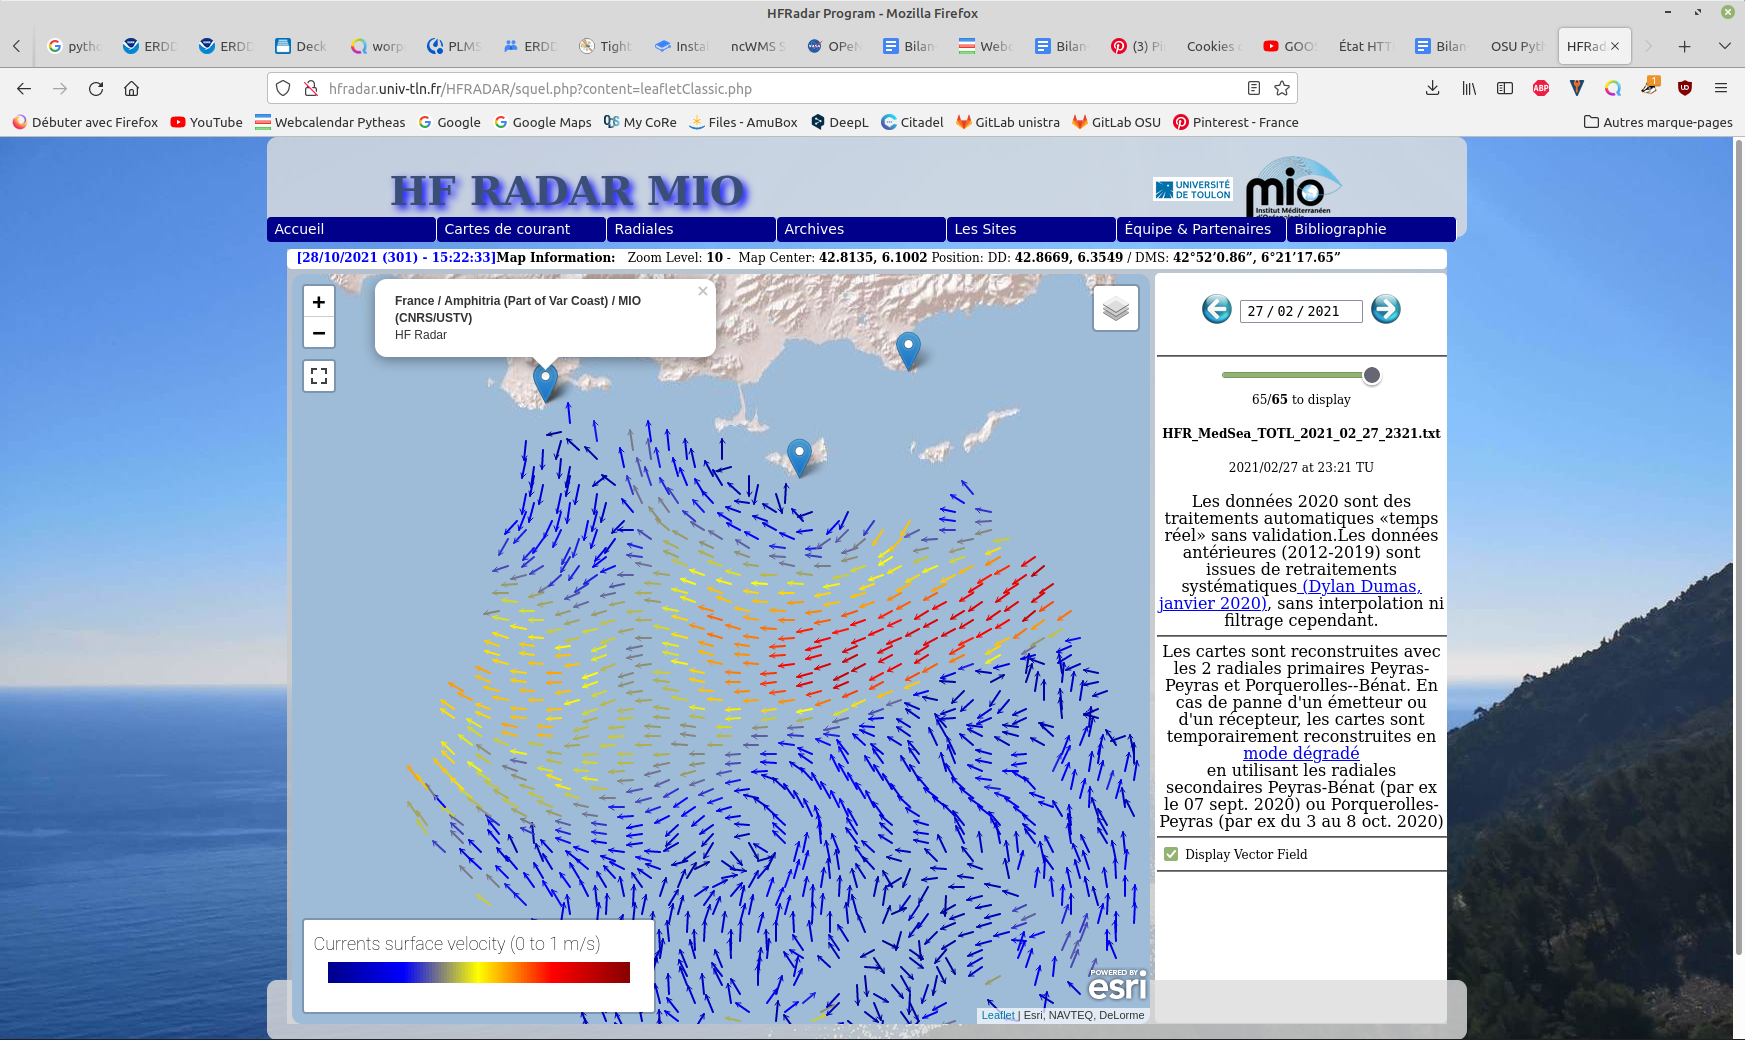
Hourly High Frequency Radar (HFR) surface current data (ocean surface velocity) from 2 different stations located on the French Mediterranean coast (Toulon), processed in real time. The total velocity is then reconstructed from the filled radial velocity files, and projected onto a cartesian grid of 1km x 1km. The HFR data comes from two systems, one monostatic radar PEY (located at Fort Peyras, La Seyne sur mer), and one bistatic POB (receiver located at Cap Bénat - Bormes les Mimosas, and transmitter on Porquerolles Island). The HFR data is initially hourly sampled. The radial velocity are processed by an algorithm of Directional of Arrival Finding with a self-calibration method developed by our laboratory. HF radar sites : - Peyras : 43°03'47.4"N, 5°51'40.3"E - Porquerolles (transmitter only): 42°58'59.0"N, 6°12'15.3"E - Bénat (receiver only): 43°05'31.5"N, 6°21'26.5"E EUROPEAN DIRECTORY OF MARINE ENVIRONMENTAL RESEARCH PROJECTS (EDMERP) : - SICOMAR PLUS(12402), IMPACT(12271), MOOSE(11574), and JERICO NEXT(12227) EQUIPEMENTS: - High Frequency Surface Wave radar WERA from HELZEL MESSTECHNIK PARAMETERS: - sea surface current Citation: - Dylan Dumas, Charles-Antoine Guerin, Self-calibration and antenna grouping for bistatic oceanographic High-Frequency Radars,2020, https://arxiv.org/abs/2005.10528
-
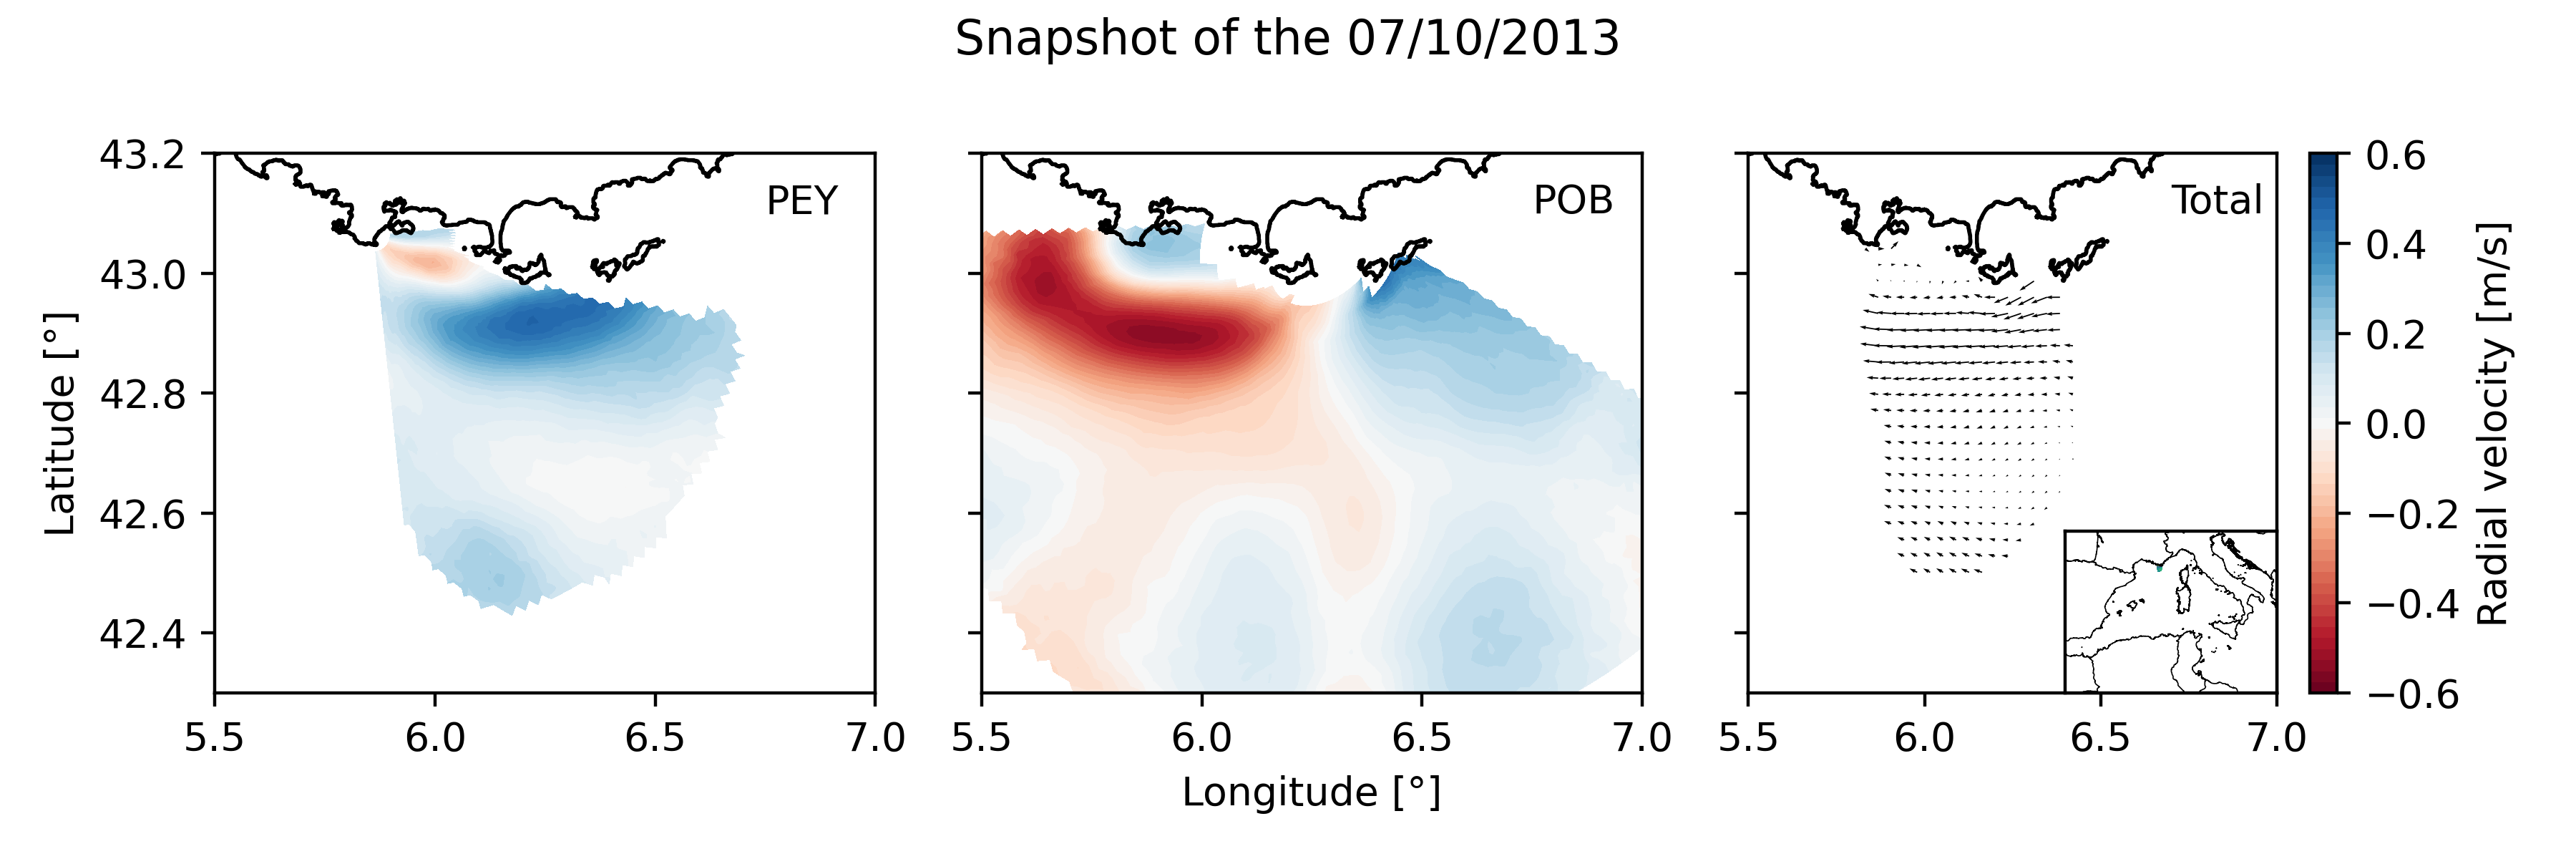
Daily High Frequency Radar (HFR) surface current data (radial velocity files and total velocity file) from 2 different stations located on the French Mediterranean coast (Toulon), spanning from January 2012 to December 2019. The radial datasets have been processed to remove outliers. Then, the gaps in the data have been filled using the DINEOF algorithm. The total velocity is then reconstructed from the filled radial velocity files, and projected onto a cartesian grid of 1km x 1km. The HFR data comes from two systems, one monostatic radar PEY (located at Fort Peyras, La Seyne sur mer), and one bistatic POB (emitter located at Cap Bénat - Bormes les Mimosas, and transmitter on Porquerolles Island). The HFR data is initially hourly sampled. To remove the outliers of the data, for each timestep, a Probability Density Function (PDF) is computed on the spatial gradient of each radial map. Pixels with a spatial gradient with a probability under 3% are removed. Additionnally, for each pixel, a PDF is computed on the temporal gradient of its whole timeseries. Timesteps with a temporal gradient that have a probability under 1% are then removed. Then we proceed to a preliminary temporal and spatial hole filling of the missing data. For the timeseries of each pixel, timesteps that are surrounded by valid values within 3 hours (i.e. 3 timesteps) are filled by a weighted linear interpolation. For each timestep, pixels of the map surrounded by values within 1 grid point are filled in the same way. The radial data is then daily averaged. The DINEOF algorithm (http://modb.oce.ulg.ac.be/mediawiki/index.php/DINEOF) is run in a multivariate way (2 radial velocity files) using 50 EOF modes for the reconstruction. At some timesteps (shown by the flag variable of the file), the filling has not been possible, and the missing maps have been replaced by the temporal average radial map. The filled radial velocities are then locally interpolated onto a cartesian grid of 1km spatial resolution using a Weighted Least Square method. HF radar sites : - Peyras : 43°03'47.4"N, 5°51'40.3"E - Porquerolles (transmitter only): 42°58'59.0"N, 6°12'15.3"E - Bénat (receiver only): 43°05'31.5"N, 6°21'26.5"E EUROPEAN DIRECTORY OF MARINE ENVIRONMENTAL RESEARCH PROJECTS (EDMERP) : - SICOMAR PLUS(12402), IMPACT(12271), MOOSE(11574), and JERICO NEXT(12227) EQUIPEMENTS: - High Frequency Surface Wave radar WERA from HELZEL MESSTECHNIK PARAMETERS: - sea surface current Citation: Molcard, A., & Bourg, N. (2021). HF RADAR - French Riviera (Mediterranean Institute of Oceanography) - daily surface currents filled with DINEOF [Data set]. MIO UMR 7294 CNRS. https://doi.org/10.34930/9263C4DF-4F55-4C5A-B183-C40EE1D844B1
-
The GeoKarla dataset gathers geophysical and petrophysical data acquired over the Karla impact structure (Tatarstan, Russia). In September 2019, a field campaign on this eroded and buried structure was performed. Magnetic and gravity field observations were done, as well as geological mapping and sampling. Further petrophysical analyses in laboratory were performed on rock samples. All these data reveal - for the first time - a clear but unusual geophysical signature of the Karla impact structure. ==== acknowledgements ====== The associated research project was funded by: Russian Foundation for Basic Research RFBR grant no.18-55-5014 CNRS PRC French program Institutes/Participants: * Aix-Marseille Université, CNRS, IRD, INRAE, Aix-en-Provence, France Quesnel, Y., Rochette, P., Gattacceca, J., Uehara, M. * Institute of Geology and Petroleum Technologies, Kazan Federal University, 4/5 Kremlyovskaya Str., 420008, Kazan, Russia Bezaeva, N.S., Kuzina, D.M., Nasyrtdinov, B.M. * V.I. Vernadsky Institute of Geochemistry and Analytical Chemistry, Russian Academy of Scences, 19 Kosygin str., 119991 Moscow, Russia Bezaeva, N.S. , Badyukov, D.D. * Institute of Physics and Technology, Ural Federal University, 19 Mira Str., 620002 Ekaterinburg, Russia Bezaeva, N.S. Chareev, D.A. * Institute Experimental Mineralogy, Russian Academy of Science, 4 Academician Osipyan Str., 142432 Chernogolovka, Moscow Region, Russia Chareev, D.A. * National University of Science and Technology “MISiS”, 4 Leninsky Prospekt, 119049 Moscow, Russia Chareev, D.A. * Université de Montpellier, CNRS, Géosciences Montpellier, France Champollion, C.
-
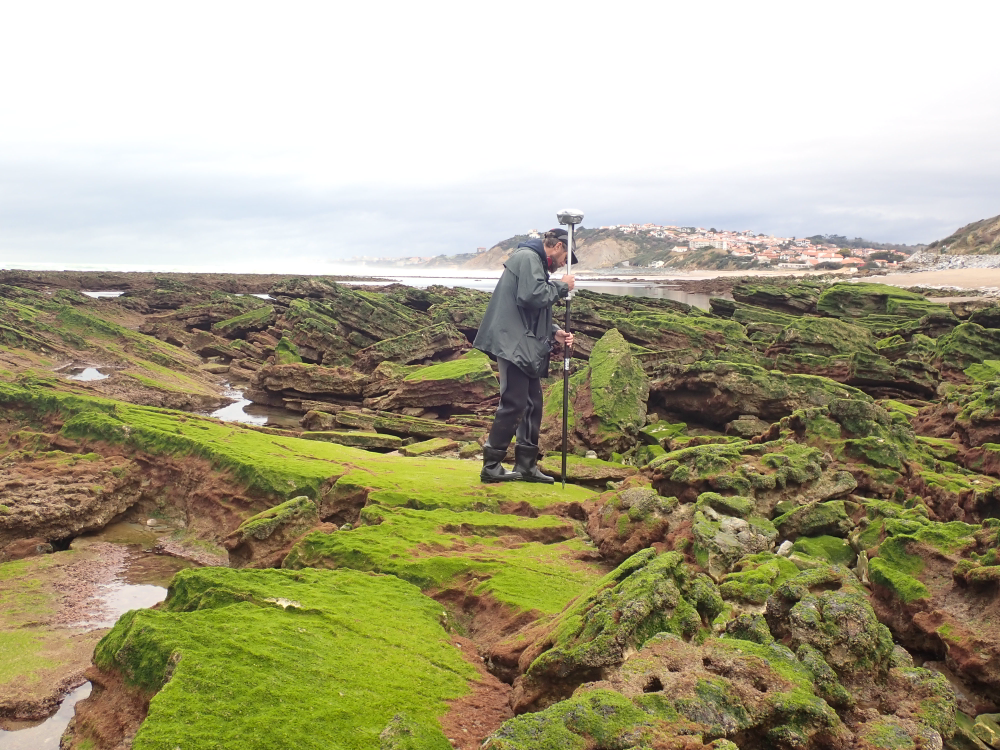
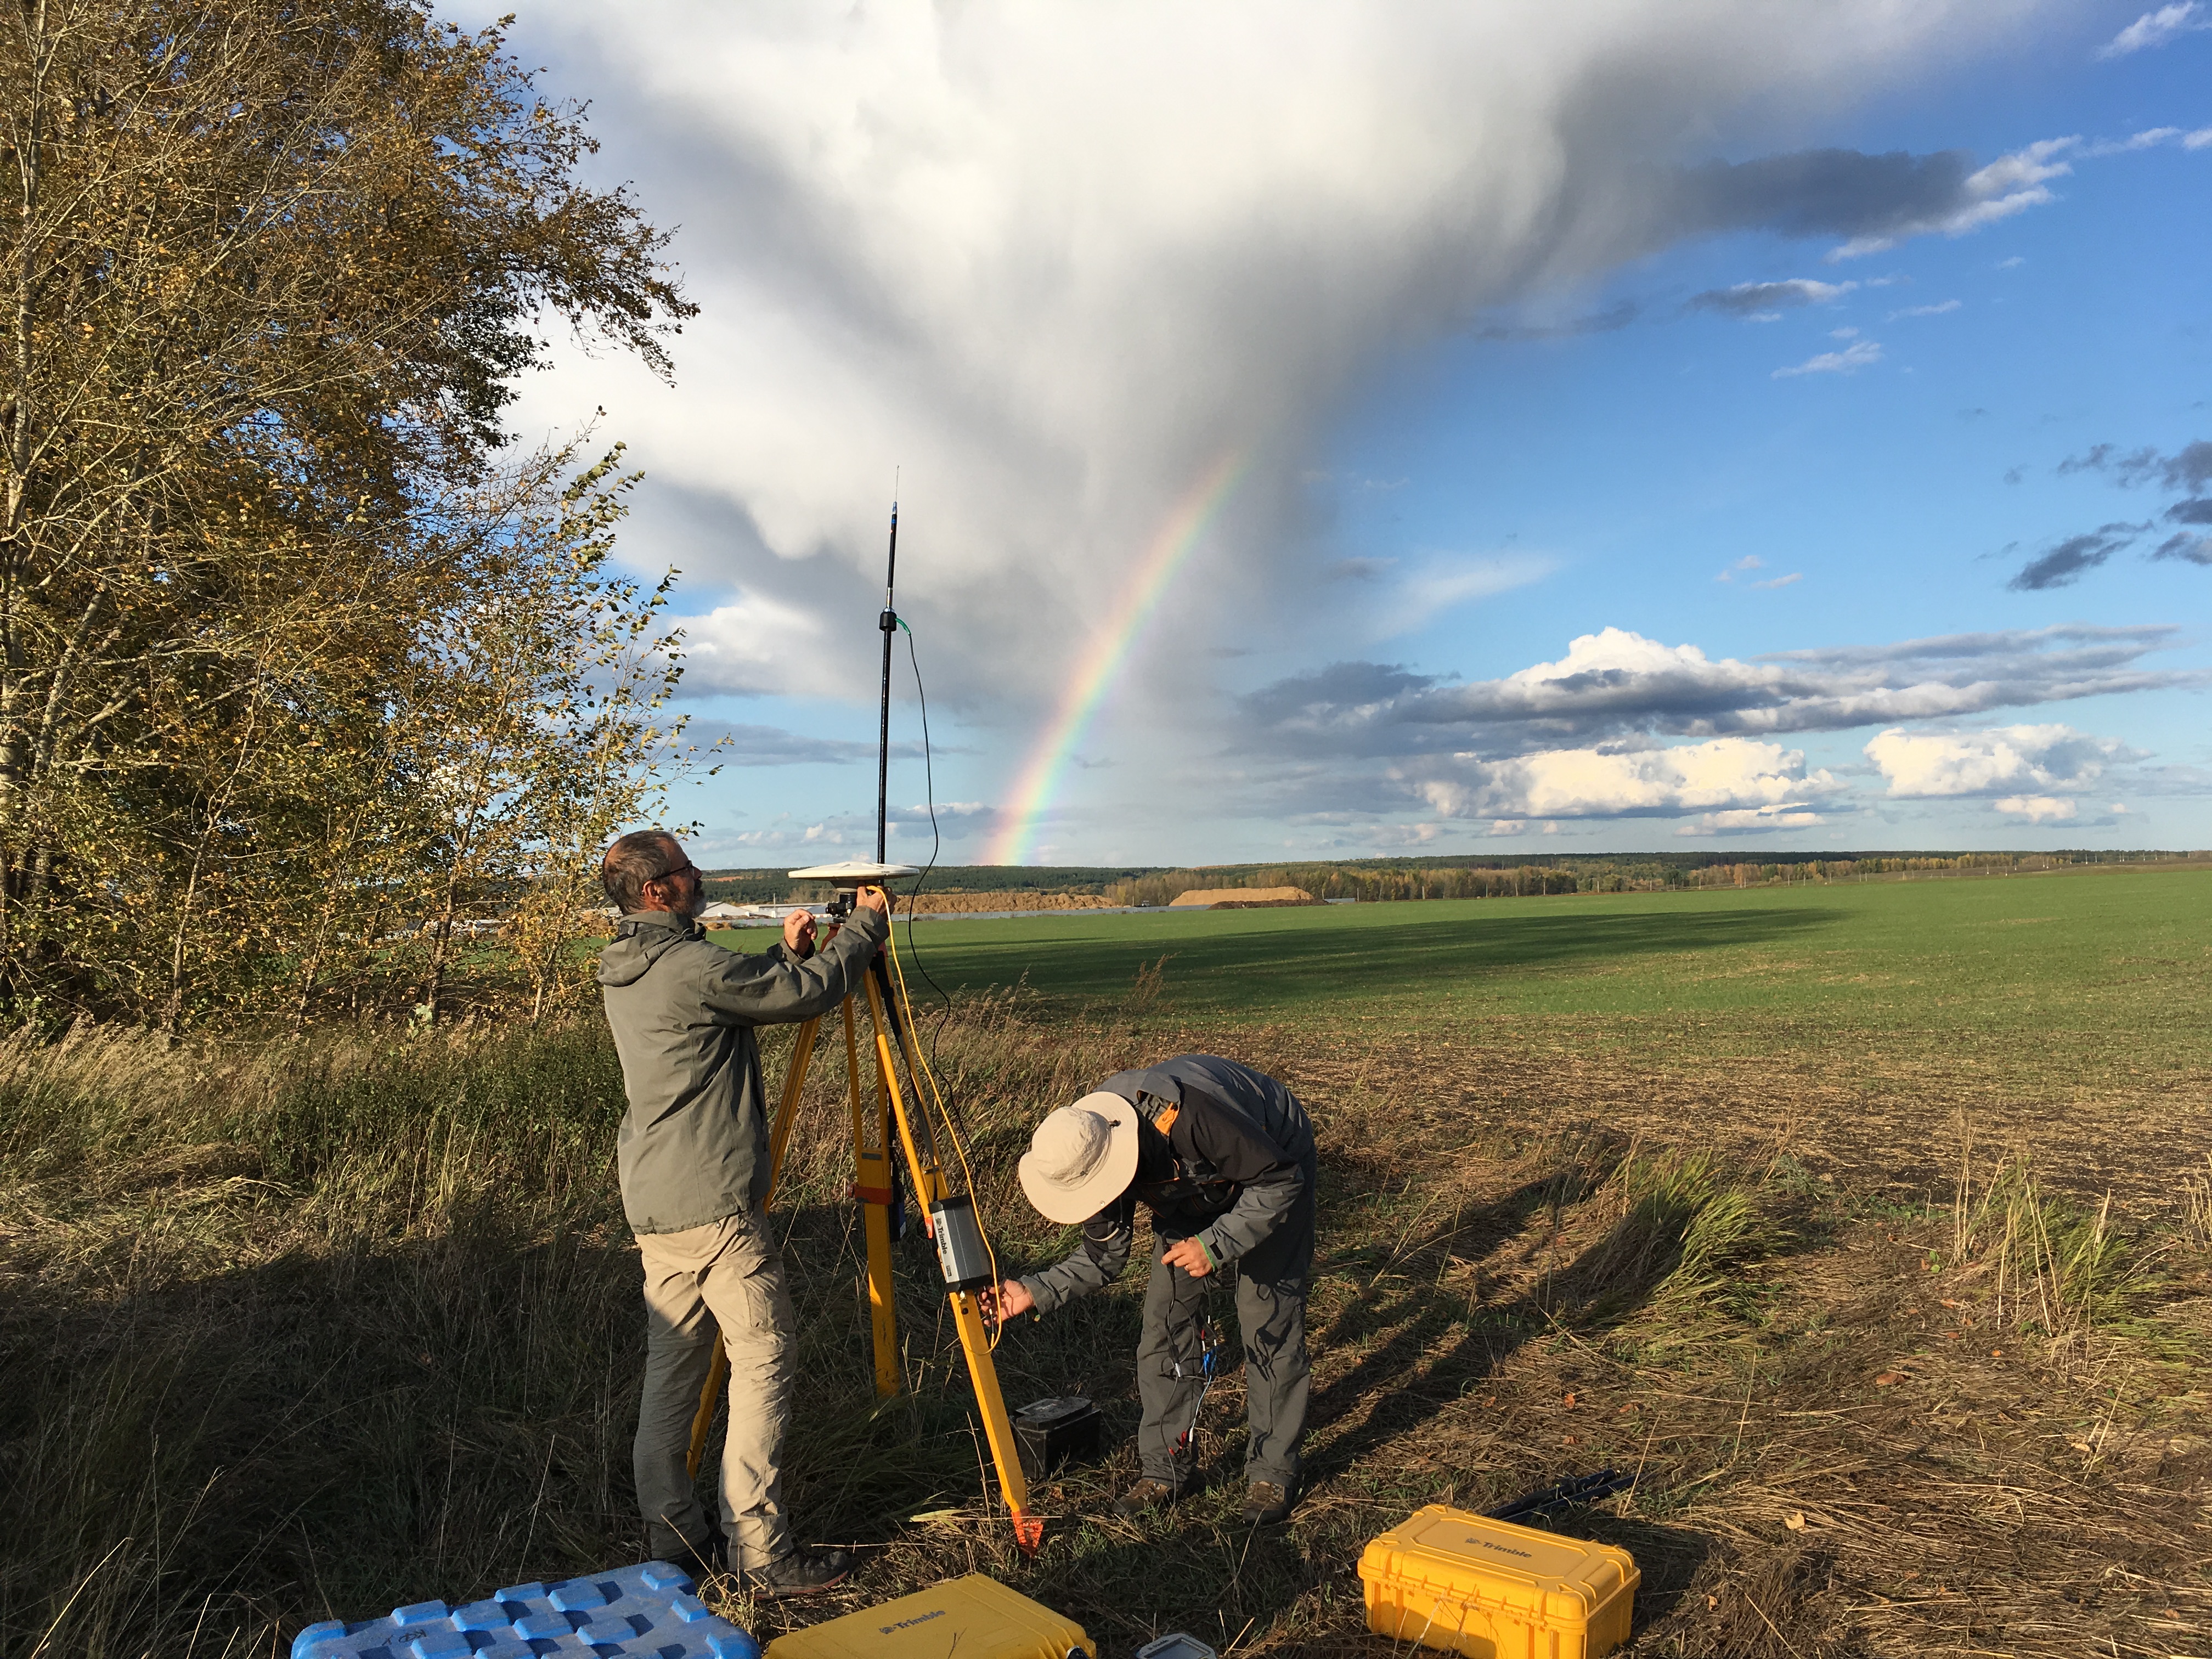
The present dataset is based on a nine site study of fine seabed topography in intertidal zones. Four coral sites (Maupiti A, B and C and Niau islands) and five rocky sites (Ars en Ré, Socoa, Parlementia A and B and Banneg island) have been explored. The data has been gathered using on-foot GNSS RTK for all sites (Trimble R8/R8S and Leica sytems) except Banneg island, where aerial Lidar data from Litto3D program has been used. The horizontal resolution varies between 3.8 and 12cm allowing to describe a wide range of spatial scales (generally over 3 spectral decades). The data has been processed to explore the statistical and spectral metrics which can be used to characterize the architectural complexity of seabeds. Owners: - Topographic survey on Ars-en-Ré : profile X, Z in meter along a transec was operated on 10-15 Jan 2021 with On-foot Trimble R8/R8S GNSS RTK by Shom, Gladys and Univ. de Montpellier - Topographic survey on Maupiti Hoe: profile X, Z in meter along a transec was operated on 5-10 July 2018 with on-foot Trimble R8/R8S GNSS RTK by GLADYS and Université de Montpellier - Topographic survey on Niau : profile X, Z in meter along a transec operated on 10 Nov. 2021 with On-foot Trimble R8/R8S GNSS RTK - by CEREGE and MIO (OSU Pytheas) - Topographic survey on Parlementia A, and B : profile X, Z in meter along a transec was operated on 22 Fev 2023 with on-foot Leica GNSS RTK by SIAME, UPPA - Topographic survey on Socoa : profile X, Z in meter along a transec was operated on 21 Fev 2023 with on-foot Leica GNSS RTK by SIAME, UPPA and Shom - Topographic survey in high resolution of Banneg island (X, Y, Z) is made by aerial lidar litto3D on spring 2012/2013 by Shom and IGN
-
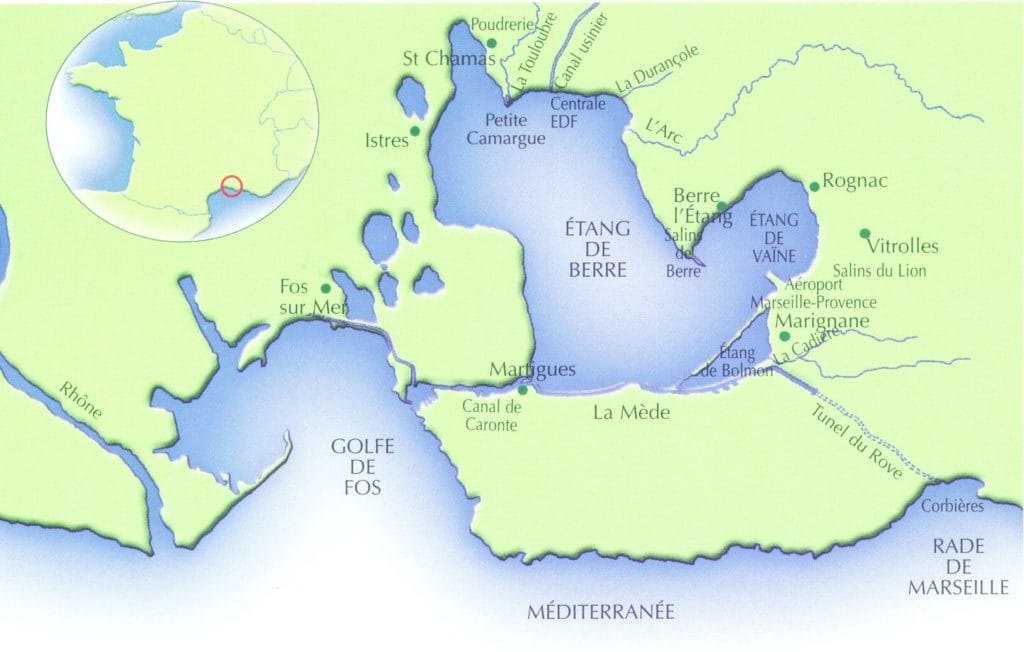
L’Observatoire du milieu porté par le GIPREB (Groupement d’Intérêt Publique pour la Réhabilitation de l’Etang de Berre) a pour vocation de suivre depuis 1994 l’évolution hydrologique et biologique de l’étang de Berre (France, Méditerranée). Le suivi mis en place au sein de l’Observatoire du GIPREB répond pour l’étang de Berre aux quatre grandes problématiques que sont : - le contrôle des apports par les bassins versants, - le contrôle de l’eutrophisation, - la contamination et - le niveau de réponse des biocénoses et habitats. L’étang de Berre, d’une superficie de 155 km2 et une lagune saumâtre (qualifiée d’« eaux de transitions » au titre de la directive-cadre sur l’eau) située dans les bouches du Rhône (France) . Sa profondeur moyenne est de 6,5 mètres, pouvant atteindre 9 mètres au centre de l’étang. Elle est reliée à la mer méditerranée par le chenal de Caronte au sud et reçoit l’eau des trois rivières que sont la Touloubre, l’Arc et la Durançole. Au sud l’étang de Bolmon (en communication avec l’étang de Berre) reçoit lui les eaux de la Cadière. Ses apports du bassin versant naturel sont complétés par ceux de la chaîne hydro-électrique Durance-Verdon dont les eaux douces sont rejetées sur les rivages nord de l’étang. (CF carte). La population du bassin versant naturel (1 700 km²) de l’étang de Berre s’élève à 600 000 habitants. Les vents sont caractérisés par deux secteurs dominants : N-NW (le mistral est le vent dominant et fréquent) et S-E. L’étang de Berre constitue un milieu eutrophe avec de fréquentes efflorescences algales et des phénomènes récurrents d’appauvrissement ou de disparition de l’oxygène de ses eaux. - informations sur l'étang de Berre : https://etangdeberre.org/comprendre/generalites-sur-letang-de-berre/ Bases de données mises à disposition : ============================== - Hydrologie : • Haute Fréquence en une station (H12) depuis 2020 : S, O2, Température à trois profondeurs (surface – milieu – fond) • Prélèvement mensuel en 10 stations en surface et fond depuis 1994 : O2, NH4, NO2, NO3, PO4, SiOH4, Nt/Pt, COP/NOP, MES, Chla/Pheo • Profil de sonde mensuel en 10 stations depuis 1994 : S, O2, T°C - Espèces benthiques depuis 2002 : Prélèvement mensuel en 8 stations - Phytoplancton : Prélèvement mensuel en 2 stations - Macrophytes depuis 2001 : Comptage annuel des macrophytes sur 31 transects - Herbier de Zostère depuis 2004 : Cartographie annuelle de tous les herbiers dans l’étang (format .shp)
-
L’Observatoire du milieu porté par le GIPREB (Groupement d’Intérêt Publique pour la Réhabilitation de l’Etang de Berre) a pour vocation de suivre depuis 1994 l’évolution hydrologique et biologique de l’étang de Berre (France, Méditerranée). Prélèvement mensuellement en 10 stations de l’étang de Berre au fond et en surface. ================================================================= * Paramètres : Sels nutritifs (NO3, NO2, PO4) ; Ammonium (NH4) ; Ptot/Ntot ; COP/NOP (carbone et azote particulaire); Pigments (Chla/Phéo) ; MES (matières en suspension) * Date de début de la série : juin 1994 * Prélèvement : Bouteille Niskin. Opérateur : GIPREB *Analyse Opérateur : Mediterranean Institute of Oceanography (MIO UMR 7294 CNRS) - Méthode NO3, NO2, PO4 : Colorimétrie (Analyseur automatique) - Méthode NH4+ : Dosage par Fluorimétrie - Méthode Chla/Phéo : Filtration et Fluorimétrie - Méthode COP/NOP (carbone et azote organique particulaire) : Filtration et Analyseur élémentaire - Méthode MES (matiere en suspension) : Filtration et Pesée Autres données HF disponibles au point H12 : Oxygène, Salinité, Température au milieu-fond-surface depuis 2020
-
L’Observatoire du milieu porté par le GIPREB (Groupement d’Intérêt Publique pour la Réhabilitation de l’Etang de Berre) a pour vocation de suivre depuis 1994 l’évolution hydrologique et biologique de l’étang de Berre (France, Méditerranée). Le suivi du benthos dans l’étang de Berre se fait depuis 2005. Il est réalisé par le GIPREB dans sa totalité. Il y a deux échelles temporelles et spatiales distinctes de suivi : 1) Les station centrales : prélèvement mensuel en 3 stations de l’étang de Berre ============================================================= *Date de début de la série : 2005 *Fréquence : Prélèvement mensuel *Coordonnés des points de stations centrales (WGS84): sur le lien WMS ci dessous *Protocole : Engin : Benne Orange peel de 1/12 m². Prélèvements tamisés à 1mm et refus de tamis et analysé pour identifier les espéces présentes Méthode : Triplicata par station et comptage/détermination des espèces présentes *Paramètres : Richesse Spécifique Densité d’individus (nombre par m²) 2) Les station côtières : prélèvement bi annuel en 10 stations de l’étang de Berre ============================================================= Date de début de la série : 2005 *Fréquence : Prélèvement Bi annuel (Aout ou septembre et décembre ou février) *Coordonnés des points de stations côtières (WGS84): sur le lien WMS ci dessous * Profondeur : 4 m *Protocole : Engin : ¼ d’une benne Benne Orange peel de 1/12 m² Méthode : Triplicata par station et comptage/détermination des espèces présentes *Paramètres : Richesse Spécifique Densité d’individus (nombre par m²) Sont disponibles deux types de fichiers : - Deux fichiers compilés l'un avec les stations centrales l'autre avec les stations côtières contenant les données de richesses spécifiques et Densité d'individus avec la nomenclature : BDD_BENTHOS_BERRE_COMPIL_ - Les fichiers brut pour chaque année avec les tableaux de comptage des espèces pour les stations côtières et centrales Citation D.O.I Raimbault, P., Mayot, N., & de Lary, H. (2021). BERRE - Donnees Especes Benthiques de l’étang de Berre 1994-2021 [Data set]. MIO UMR 7294 CNRS. https://doi.org/10.34930/73258458-AA22-4937-A00D-C28E2DD0B0B5
-
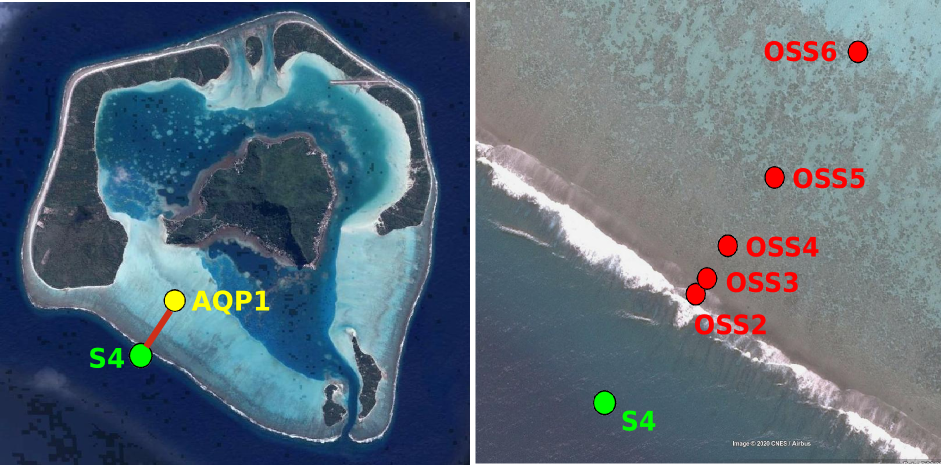
Maupiti ("the Stuck Twins'') is a diamond-shaped island located in the western part of the Society archipelago in French Polynesia. The present study focuses on the data recovered over a single cross-barrier transect located in the south-west barrier during the MAUPITI HOE field campaign, from 5 to 18 July 2018. The studied area is representative of the reef structure observed along the 4km-long southwestern barrier reef, showing an alongshore-uniform structure exposed to swell approaching with weak incident angles, a healthy reef colony. In the cross-barrier direction, the reef displays a clear partitioning of bottom roughness that ranges from low-crested compact structures at the reef crest to higher and sparser coral bommies on the backreef. The experimental setup was specifically designed to analyse and differentiate the dynamics over three roughness-contrasting sections found over the barrier reef. Four pressure sensors (OSS3, OSS4, OSS5, OSS6) have been deployed across the reef flat/ backreef, outside the surf zone. The bottom pressure is measured continuously at 10 Hz, and are converted into free surface elevation assuming hydrostaticity. An electrocurrent meter S4 provides the wave forcing while AQP1 is a velocity profiler providing the transports. The bed profile is obtained from the combination of (I) boat survey in the deeper part and (ii) high resolution GNSS RTK topography by feet. S4 position : -16.47109°N; -152.2782°E OSS3 position: -16.46968°N; -152.27698°E OSS4 position : -16.46931°N; -152.27676°E OSS5 position : -16.46851°N;-152.27614°E OSS6 position: -16.46706°N; -152.27504°E AQP1 position: -16.46318°N ; -152.27348°E
-
The scientific objectives of the project MAUPITI HOE are to understand the hydrodynamics of an archetypal reef-lagoon system of a high volcanic reef island. The physical functioning of the hydrosystem involves a fine coupling between water levels, waves (including wind, infragravity and VLF waves), currents and seabed structure (reef roughness). The present data focuses on the reef barrier dynamics. Citation: - Sous D., Bouchette F., Certain R., Meulé S. (2021). Maupiti Hoe 2018 [Data set]. MIO UMR 7294 CNRS, GLADYS. https://doi.org/10.34930/9DB3BEC4-0BBF-4531-8864-F100C4B8ECED
-
Maupiti ("the Stuck Twins'') is a diamond-shaped island located in the western part of the Society archipelago in French Polynesia. The present study focuses on the data recovered over a single cross-barrier transect located in the south-west barrier during the MAUPITI HOE field campaign, from 5 to 18 July 2018. The studied area is representative of the reef structure observed along the 4km-long southwestern barrier reef, showing an alongshore-uniform structure exposed to swell approaching with weak incident angles, a healthy reef colony. In the cross-barrier direction, the reef displays a clear partitioning of bottom roughness that ranges from low-crested compact structures at the reef crest to higher and sparser coral bommies on the backreef. The experimental setup was specifically designed to analyse and differentiate the dynamics over three roughness-contrasting sections found over the barrier reef. The scientific objectives of the project MAUPITI HOE are to understand the hydrodynamics of an archetypal reef-lagoon system of a high volcanic reef island. The physical functioning of the hydrosystem involves a fine coupling between water levels, waves (including wind, infragravity and VLF waves), currents and seabed structure (reef roughness). Four pressure sensors (OSS3, OSS4, OSS5, OSS6) have been deployed across the reef flat/ backreef, outside the surf zone. The bottom pressure is measured continuously at 10 Hz, and are converted into free surface elevation assuming hydrostaticity. An electrocurrent meter S4 provides the wave forcing while AQP1 is a velocity profiler providing the transports. The bed profile is obtained from the combination of (I) boat survey in the deeper part and (ii) high resolution GNSS RTK topography by feet. Two datasets are available: one is concerning the mean parameters linked to the reef barrier dynamics, and the second dataset is concerning the wave friction.